
Page 304 - Proceeding 2015
P. 304
FAMP BADEA Carmen Georgiana and ANGHELU?Ă Petrică Sorin
CCASP ACTIVATION OF THE HUMAN POTENTIAL THROUGH EDUCATION AND TRAINING
of enlarging people's choices. The most critical of these wide-ranging choices are to live a long and
healthy life, to be educated and to have access to resources needed for a decent standard of living.
Additional choices include political freedom, guaranteed human rights and personal self-respect.” (UNDP,
1990). Classical theory of economic development, based simply on GDP, considered the human being
as an economic development force aiming to achieve social progress. The concept of human
development has replaced the classic theories of economic development. The Human Development Index
(HDI) measures achievements of a nation in terms of health, education and real income of citizens. It
believes that to evaluate a country's development is not enough to consider only economic growth. The
HDI was designed to assess a country's development given the people and their capabilities. HDI has a
component on education. The education index variation for Romania, for the period 1980-2013, is
presented in Table 1.
TABLE 1 - THE EDUCATION INDEX VARIATION FOR ROMANIA, FOR THE PERIOD 1980-2013
Year Education index
1980 0,597300
1985 0,618433
1990 0,637311
1995 0,623856
2000 0,653900 PROCEEDINGS OF THE 11 TH ADMINISTRATION AND PUBLIC MANAGEMENT INTERNATIONAL CONFERENCE ”Strategic Management for Local Communities” 30 th – 31 st October 2015 Bucharest
2005 0,708633
2006 0,717371
2007 0,731665
2008 0,748065
2009 0,754178
2010 0,746929
2011 0,747894
2012 0,747894
2013 0,747894
Source: conducted by the authors based on existing information on the website of the United Nations
Development Programme
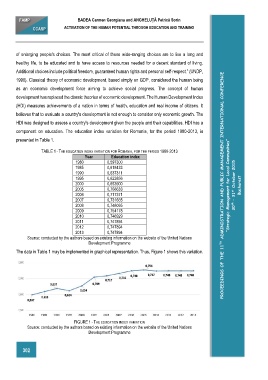
The data in Table 1 may be implemented in graphical representation. Thus, Figure 1 shows this variation.
FIGURE 1 - THE EDUCATION INDEX VARIATION
Source: conducted by the authors based on existing information on the website of the United Nations
Development Programme
302