
Page 307 - Proceeding 2015
P. 307
BADEA Carmen Georgiana and ANGHELU?Ă Petrică Sorin FAMP
ACTIVATION OF THE HUMAN POTENTIAL THROUGH EDUCATION AND TRAINING CCASP
The Level of the educational institution graduated.
population Upper-
aged 10 Secondary Vocational Lower- With no
years and Higher and Post- school and Secondary Primary schooling
over Secondary apprenticeship (Gymnasium)
PROCEEDINGS OF THE 11 TH ADMINISTRATION AND PUBLIC MANAGEMENT INTERNATIONAL CONFERENCE
Total - 48,33 13,75 27,60 19,13 24,91 12,09 2,52
male
Total- 51,67 14,96 27,50 8,96 28,98 16,14 3,45
female
Source: conducted by the authors based on existing information on the website of the National Statistics Institute
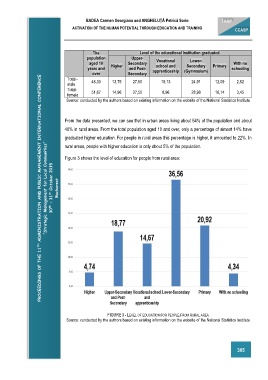
From the data presented, we can see that in urban areas living about 54% of the population and about
46% in rural areas. From the total population aged 10 and over, only a percentage of almost 14% have
graduated higher education. For people in rural areas this percentage is higher, it amounted to 22%. In
rural areas, people with higher education is only about 5% of the population.
Figure 3 shows the level of education for people from rural area:
30 th – 31 st October 2015 ”Strategic Management for Local Communities” Bucharest
FIGURE 3 - LEVEL OF EDUCATION FOR PEOPLE FROM RURAL AREA
Source: conducted by the authors based on existing information on the website of the National Statistics Institute
305