
Page 204 - Proceeding 2015
P. 204
FAMP BRI?CARIU Roxana
CCASP LAKE OF UTILITIES. ACCESS TO LOCAL UTILITIES OF ROMA CITIZENS COMPARATIVE WITH
NON-ROMA POPULATION
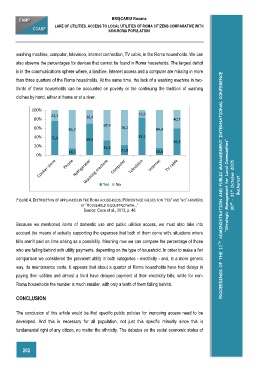
washing machine, computer, television, internet connection, TV cable, in the Roma households. We can
also observe the percentages for devices that cannot be found in Roma households. The largest deficit
is in the communications sphere where, a landline, Internet access and a computer are missing in more
PROCEEDINGS OF THE 11 TH ADMINISTRATION AND PUBLIC MANAGEMENT INTERNATIONAL CONFERENCE
than three quarters of the Roma households. At the same time, the lack of a washing machine in two-
thirds of these households can be accounted on poverty or the continuing the tradition of washing
clothes by hand, either at home or at a river.
100%
24,1 30,4 16,9
80% 40,7
67,4
60% 78,2
85,7 84,4
40% 75,9 83,1
69,6
59,3
20%
32,6
14,3 21,8 15,6
0%
30 th – 31 st October 2015 Bucharest
Yes No ”Strategic Management for Local Communities”
FIGURE 4. DISTRIBUTION OF APPLIANCES IN THE ROMA HOUSEHOLDS. PERCENTAGE VALUES FOR ”YES” AND ”NO” ANSWERS
AT ”HOUSEHOLD IS EQUIPPED WITH...”
Source: Cace et al., 2013, p. 46
Because we mentioned items of domestic use and public utilities access, we must also take into
account the means of actually supporting the expenses that both of them come with, situations where
bills aren’t paid on time arising as a possibility. Meaning now we can compare the percentage of those
who are falling behind with utility payments, depending on the type of household. In order to make a fair
comparison we considered the prevalent utility in both categories - electricity - and, in a more generic
way, its maintenance costs. It appears that about a quarter of Roma households have had delays in
paying their utilities and almost a third have delayed payment of their electricity bills, while for non-
Roma households the number is much smaller, with only a tenth of them falling behind.
CONCLUSION
The conclusion of this article would be that specific public policies for improving access need to be
developed. And this is necessary for all population, not just this specific minority since this is
fundamental right of any citizen, no matter the ethnicity. The debates on the social economic status of
202