
Page 209 - Proceeding 2015
P. 209
LECA Iuliana FAMP
A NEW WAY OF STRATEGIC THINKING – BOOSTING SUSTAINABLE URBAN MOBILITY PLANS-
CCASP
ROMANIAN CASE
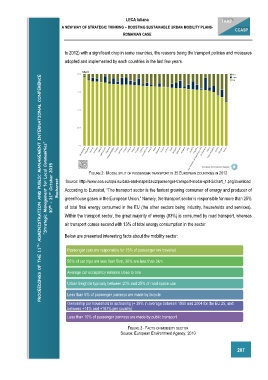
to 2012) with a significant drop in some countries, the reasons being the transport policies and measures
adopted and implemented by each countries in the last few years.
PROCEEDINGS OF THE 11 TH ADMINISTRATION AND PUBLIC MANAGEMENT INTERNATIONAL CONFERENCE
30 th – 31 st October 2015 ”Strategic Management for Local Communities” Bucharest According to Eurostat, “The transport sector is the fastest growing consumer of energy and producer of
FIGURE 2 - MODAL SPLIT OF PASSENGER TRANSPORT IN 35 EUROPEAN COUNTRIES IN 2012
Source: http://www.eea.europa.eu/data-and-maps/daviz/passenger-transport-modal-split-2/chart_1.png/download
greenhouse gases in the European Union.” Namely, the transport sector is responsible for more than 25%
of total final energy consumed in the EU (the other sectors being industry, households and services).
Within the transport sector, the great majority of energy (83%) is consumed by road transport, whereas
air transport comes second with 13% of total energy consumption in the sector.
Below are presented interesting facts about the mobility sector:
Passenger cars are responsible for 75% of passenger km travelled
50% of car trips are less than 5km, 30% are less than 3km
Average car occupancy remains close to one
Urban freight is typically between 20% and 25% of road space use
Less than 5% of passenger journeys are made by bicycle
Ownership per household is increasing (+ 38% in average between 1990 and 2004 for the EU 25, and
between +14% and +167% per country)
Less than 10% of passenger journeys are made by public transport
FIGURE 3 - FACTS ON MOBILITY SECTOR
Source: European Environment Agency, 2010
207