
Page 202 - Proceeding 2015
P. 202
FAMP BRI?CARIU Roxana
CCASP LAKE OF UTILITIES. ACCESS TO LOCAL UTILITIES OF ROMA CITIZENS COMPARATIVE WITH
NON-ROMA POPULATION
To give a better image of the households comfort, I have used an index of present utilities that will
include data about access to these six public utilities: sewerage, gas, electricity, public heating network,
running water, hot water. Through these analyzed statistics we are able to see how many residences
PROCEEDINGS OF THE 11 TH ADMINISTRATION AND PUBLIC MANAGEMENT INTERNATIONAL CONFERENCE
have access to these six utilities, and what percent of the Roma citizens are actually living in extreme
poverty, suffering from a lack of any kind of utilities. I then compared the values in this index between
Roma population and the non-Roma one, depending on the exponential trend line between both
samples.
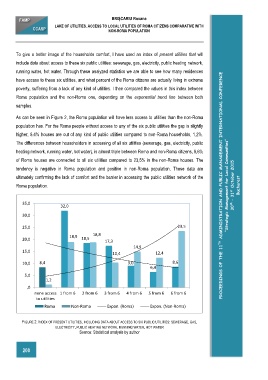
As can be seen in Figure 2, the Roma population will have less access to utilities than the non-Roma
population has. For the Roma people without access to any of the six public utilities the gap is slightly
higher, 8.4% houses are out of any kind of public utilities compared to non-Roma households, 1,2%.
The differences between householders in accessing of all six utilities (sewerage, gas, electricity, public
heating network, running water, hot water), is almost triple between Roma and non-Roma citizens, 8,6%
of Roma houses are connected to all six utilities compared to 23,5% in the non-Roma houses. The
30 th – 31 st October 2015 ”Strategic Management for Local Communities” Bucharest
tendency is negative in Roma population and positive in non-Roma population. These data are
ultimately confirming the lack of comfort and the barrier in accessing the public utilities network of the
Roma population.
35,0
32,0
30,0
25,0 23,5
18,9 18,8
20,0 18,5
17,3
14,9
15,0
10,4 12,4
10,0 8,4 9,0 8,6
6,4
5,0
1,2
,0
none access 1 from 6 2 from 6 3 from 6 4 from 6 5 from 6 6 from 6
to utilities
Roma Non-Roma Expon. (Roma) Expon. (Non-Roma)
FIGURE 2. INDEX OF PRESENT UTILITIES, INCLUDING DATA ABOUT ACCESS TO SIX PUBLIC UTILITIES: SEWERAGE, GAS,
ELECTRICITY, PUBLIC HEATING NETWORK, RUNNING WATER, HOT WATER
Source: Statistical analysis by author
200