
Page 201 - Proceeding 2015
P. 201
BRI?CARIU Roxana FAMP
LAKE OF UTILITIES. ACCESS TO LOCAL UTILITIES OF ROMA CITIZENS COMPARATIVE WITH
NON-ROMA POPULATION CCASP
only for the head of the household in Romania and Bulgaria since no information was available at the
individual level. The proportion of people reporting high levels of feeling threatened by illness varies
widely across the three countries. In Bulgaria, 41% of the respondents selected the two highest levels of
PROCEEDINGS OF THE 11 TH ADMINISTRATION AND PUBLIC MANAGEMENT INTERNATIONAL CONFERENCE
threat, but in Hungary only 18% did so. The Roma and those belonging to other ethnic minority groups
are more likely to feel threatened because of the unhygienic conditions in which they live than the
national majority population in all three countries” (Masseria et al., 2010, p. 551).
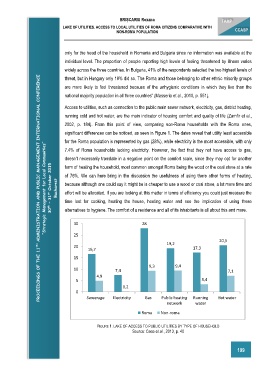
Access to utilities, such as connection to the public main sewer network, electricity, gas, district heating,
running cold and hot water, are the main indicator of housing comfort and quality of life (Zamfir et al.,
2002, p. 184). From this point of view, comparing non-Roma households with the Roma ones,
significant differences can be noticed, as seen in Figure 1. The dates reveal that utility least accessible
for the Roma population is represented by gas (28%), while electricity is the most accessible, with only
7.4% of Roma households lacking electricity. However, the fact that they not have access to gas,
doesn’t necessarily translate in a negative point on the comfort scale, since they may opt for another
30 th – 31 st October 2015 ”Strategic Management for Local Communities” Bucharest of 76%. We can here bring in the discussion the usefulness of using there other forms of heating,
form of heating the household, most common amongst Roma being the wood or the coal stove at a rate
because although one could say it might be is cheaper to use a wood or coal stove, a lot more time and
effort will be allocated. If you are looking at this matter in terms of efficiency you could just measure the
time lost for cooking, heating the house, heating water and see the implication of using these
alternatives to hygiene. The comfort of a residence and all of its inhabitants is all about this and more.
30 28
25
20,5
19,2
20
16,7 17,3
15
9,3 9,4
10 7,4 7,1
4,9
5 3,4
0,2
0
Sewerage Electricity Gas Public heating Running Hot water
network water
Roma Non-roma
FIGURE 1. LAKE OF ACCESS TO PUBLIC UTILITIES BY TYPE OF HOUSEHOLD
Source: Cace et al., 2013, p. 40
199