
Page 252 - Proceeding 2015
P. 252
FAMP ANDRONICEANU Armenia and OHANYAN Gurgen
CCASP IMF POLICIES AND THEIR EFFECTS ON EDUCATION IN ROMANIA
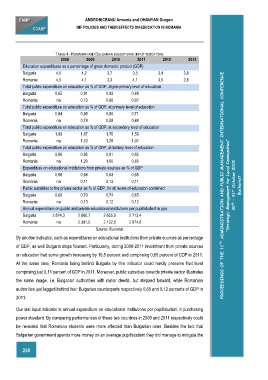
TABLE 4 - ROMANIAN AND BULGARIAN EDUCATIONAL INPUT INDICATORS
2008 2009 2010 2011 2012 2013
Education expenditures as a percentage of gross domestic product (GDP)
Bulgaria 4,0 4,2 3,7 3,5 3,4 3,8
Romania 4,5 4,1 3,3 4,1 3,0 2,8
Total public expenditure on education as % of GDP, at pre-primary level of education
Bulgaria 0,85 0,91 0,92 0,88
Romania na 0,73 0,66 0,67
Total public expenditure on education as % of GDP, at primary level of education
Bulgaria 0,84 0,85 0,80 0,71
Romania na 0,78 0,58 0,49
Total public expenditure on education as % of GDP, at secondary level of education
Bulgaria 1,89 1,87 1,76 1,59
Romania na 1,53 1,28 1,07
Total public expenditure on education as % of GDP, at tertiary level of education
Bulgaria 0,86 0,95 0,61 0,65
Romania na 1,20 1,00 0,85
Expenditure on educational institutions from private sources as % of GDP
Bulgaria 0,56 0,66 0,63 0,65
Romania na 0,11 0,12 0,11
Public subsidies to the private sector as % of GDP, for all levels of education combined PROCEEDINGS OF THE 11 TH ADMINISTRATION AND PUBLIC MANAGEMENT INTERNATIONAL CONFERENCE ”Strategic Management for Local Communities” 30 th – 31 st October 2015 Bucharest
Bulgaria 0,60 0,70 0,74 0,65
Romania na 0,13 0,12 0,12
Annual expenditure on public and private educational institutions per pupil/student in pps
Bulgaria 2.874,3 2.860,7 2.655,0 2.713,4
Romania na 2.391,0 2.132,5 2.074,6
Source: Eurostat
By another indicator, such as expenditures on educational institutions from private sources as percentage
of GDP, as well Bulgaria steps forward. Particularly, during 2008-2011 investment from private sources
on education had some growth increasing by 16,5 percent and comprising 0,65 percent of GDP in 2011.
At the same time, Romania being behind Bulgaria by this indicator could hardly preserve that level
comprising just 0,11 percent of GDP in 2011. Moreover, public subsidies towards private sector illustrates
the same image, i.e. Bulgarian authorities with minor deeds, but stepped forward, while Romanian
authorities just lagged behind their Bulgarian counterparts respectively 0,65 and 0,12 percents of GDP in
2011.
Our last input indicator is annual expenditure on educational institutions per pupil/student in purchasing
power standard. By comparing performances of these two countries in 2009 and 2011 respectively could
be revealed that Romanian students were more affected than Bulgarian ones. Besides the fact that
Bulgarian government spends more money on an average pupil/student they did manage to mitigate the
250