Page 231 - Proceeding 2015
P. 231

ANGHELU?Ă Petrică Sorin and BADEA Carmen Georgiana          FAMP
                                      CAPITALIZATION OF ENERGY RESOURCES IN TERRITORIAL ASPECT            CCASP


                                          TABLE 2 - TOTAL PRIMARY ENERGY RESOURCES AND COAL, FOR THE PERIOD 1992-2013
                                                                   Categories of primary energy sources
                                             Year
                                                             Total energy resources      of which: coal
                                             1992                   50.943                  12.171
                                             1993                   50.683                  10.793
                   PROCEEDINGS OF THE 11 TH  ADMINISTRATION AND PUBLIC MANAGEMENT INTERNATIONAL CONFERENCE
                                             1994                   50.164                  11.523
                                             1995                   55.941                  12.172
                                             1996                   55.936                  12.109
                                             1997                   51.275                  11.397
                                             1998                   46.205                   9.381
                                             1999                   39.791                   7.511
                                             2000                   40.360                   8.058
                                             2001                   42.664                   8.977
                                             2002                   43.992                   9.775
                                             2003                   45.377                   9.912
                                             2004                   47.137                   9.611
                                             2005                   47.289                   9.408
                                             2006                   47.630                   9.906
                                             2007                   47.460                  10.616
                                             2008                   48.166                  10.130
                                             2009                   42.729                   8.078
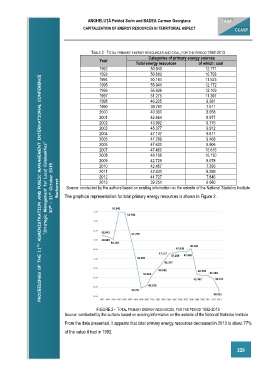
                        30 th  – 31 st  October 2015  ”Strategic Management for Local Communities”   Bucharest   The graphical representation for total primary energy resources is shown in Figure 2.
                                                                                             7.393
                                                                    42.467
                                             2010
                                                                                             8.299
                                                                    42.430
                                             2011
                                             2012
                                                                    41.727
                                                                                             7.846
                                                                                             6.060
                                                                    39.251
                                             2013
                               Source: conducted by the authors based on existing information on the website of the National Statistics Institute


                                            FIGURE 2 -  TOTAL PRIMARY ENERGY RESOURCES, FOR THE PERIOD 1992-2013
                              Source: conducted by the authors based on existing information on the website of the National Statistics Institute

                              From the data presented, it appears that total primary energy resources decreased in 2013 to about 77%
                              of the value it had in 1992.


                                                                                                          229
   226   227   228   229   230   231   232   233   234   235   236